


*** Updated June 14, 2013 ***
Current Version = 2.04
Major changes:
14/06/2013 - Details completion
03/06/2013 - New major release V2.0
29/05/2013 - Typo correction
To install this addon, follow this link on Splunkbase or install it through the standard Splunk application process search online:
http://splunk-base.splunk.com/apps/74262/splunk-for-netfilter-iptables
Splunk pre-requirements:
Ensure to install requirements Splunk addons:
- Sideview utils addon (V2, not the older version available in Splunk base)
- Google Maps addon
- Maxmind geo location addon
Splunk For Netfilter Iptables:
Home application page:
Centralized Home page including Real time alert trend and majors stats:


Page Details:
1. Realtime view menu with statically defined time window
Access to following views in Realtime data analysis mode with major time window:
- Activity Overview: Complete analysis of Iptables activity with charts and stats
- Google Map: World map overview of identified origin connections
2. View menu with TimeRange button access
Access to following views:
- Activity Overview: Complete analysis of Iptables activity with charts and stats
- Google Map: World map overview of identified origin connections
- Event Search: Event search interface using various filters
3. Quick Activity Overview

- Total number of connections denied in Realtime mode with a 24 hours time window
- Date and hour of the first event indexed in Iptables index
- Date and hour of the last event indexed in Iptables index
4. Alert trend:
Alert trend of denied connection activity in Realtime mode using a 24 hours time window: (Area chart)

5. Top Offenser stats:

Major stats about Top offenser in Realtime 24 hours time window mode:
- Client IP: IP with the higher number of connections denied
- Last Event Time: Date and hour of last connection occurence
- Connections denied: Total number of connections denied for this host
- Country origin: Identified country origin of this host (Unknown of unidentified)
- Last destination IP: Last event destination IP
- Last protocol: Last event protocol
- Last source port: Last event source port
- Last destination port: Last event destination port
- Last service: Last event network service name (Unknown if non IANA reserved port)
- Reporting server: Last event reporting server for this host
6. Last connections denied stats:

Major stats about last connection denied in Realtime 24 hours time window mode:
- Client IP: IP of the last denied connection
- Event Time: Date and hour of last connection denied
- Interface: Logical interface name reported by Iptables
- Country origin: Identified country origin of this host (Unknown of unidentified)
- Destination IP: Destination IP of this event
- Protocol: Protocol reported of this event
- Source port: Source connection port
- Destination port: Destination connection port
- Service: Network service name (Unknown if non IANA reserved port)
- Reporting server: Reporting server for this connection
Iptables Activity Overview Dashboard (Realtime/Timerange):


Dashboard details
1. Timerange overview:

- Span Time value:
The span time value is dynamically defined using a Macro to get the best chart granularity, this is being used in chart command using "span=$Span$"
In Realtime mode, this is statically defined to 1 minute, in Timerange mode the range value can be automatically set from 5 minutes to several hours depending of the time range width.
- Begin Time Analysis: Date and hour of the begining of the selected time range
- End Time Analysis: Date and hour ot the end of the selected time range
2. Activity Summary:
This section presents various stats about more important informations of Iptables activity:

- Number of connections denied: Total number of connections denied within the time range
- Top offenser: Client IP with the highest number of connections denied
- Denied for Top offenser: Total number of connections denied for the Top offenser host
- Country origin for Top Offenser: Country origin for this host, Unknown if can't be identified
- Top Protocol: Protocol most often attempted within the selected time range
- Top Source port: Source port most often attempted
- Top Destination port: Destination port most often attempted
- Top Identified network service: Network service most often attempted
- Top Destination IP: Destination IP most often reported
- Top Country origin: Identified country most often reported
- Top Reporting Host: Iptables host with the highest number of denied connections
3. Alert trend chart and peak load identification:

This sections shows:
- Alert trend by Iptables reporting host:
For Realtime, the span value (eg. span=) is statically defined in the XML hard code
For Timerange, the span value is dynamically defined by a macro (see Macro.conf) depending on the width of the time range itself, the goal here is to get the better chart granularity possible
- Peak load identification:
We identify here the peak load within the selected time range, how many connections were refused (drop and deny) and when.
Then this is being represented inside inside a gauge where the range (green, yellow, red range) will dynamically be defnied by a subsearch inside the global query.
These gauge range values will depend on the arithmetical mean result of denied connections for past 48 hours, the goal is to represent a potentil abnormal Iptables activity. (eg. being under attack)
The analysis result here should always equivalent between the chart and peak load. (both are cumulated results for all reporting hosts)
4. Last Events:

Last 100 events represented by major type of data, click on show result to export them or change the request.
4. TOP Source IP and Country Origin:
- Top 10 pie chart and Top 100 data client IP with country origin identification
- Top 10 pie chart and Top 100 country origin of denied connections
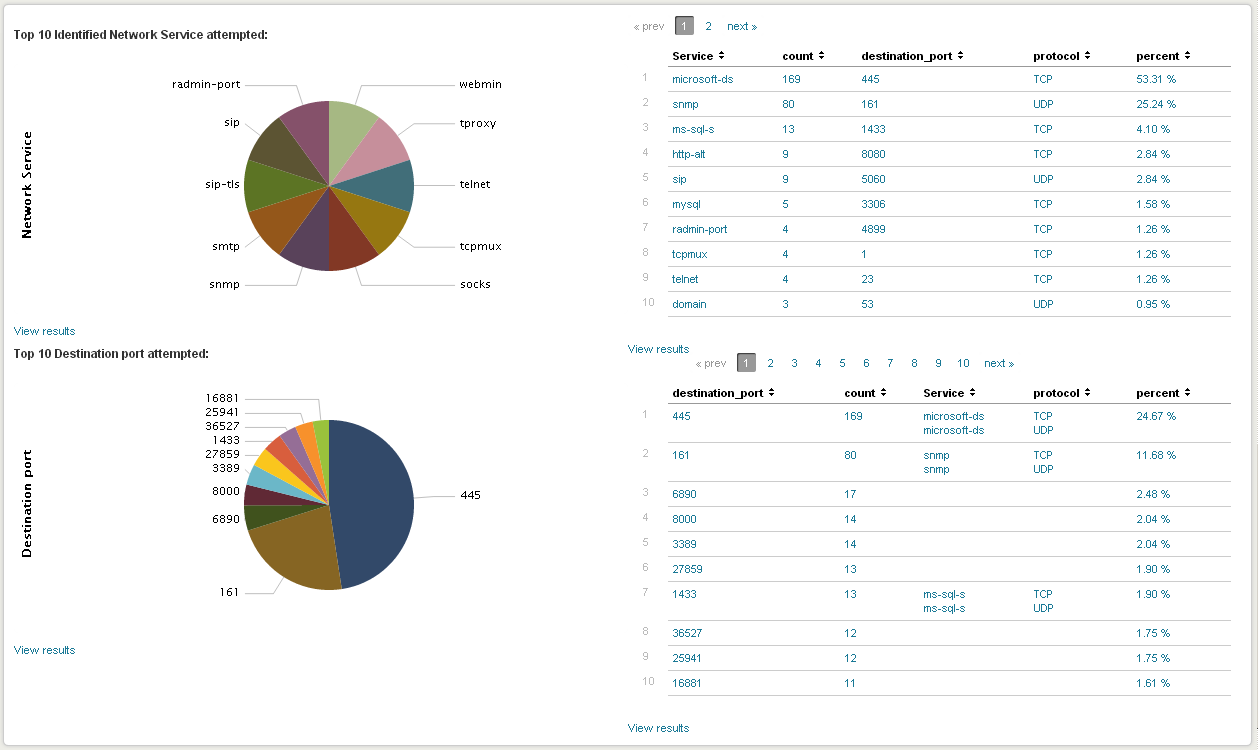
5. TOP Network Services and Destination Port:
Data is being represented by:
- Top 10 pie chart and Top 100 data Network Services attempted:
Network services are identified whenever they are destination port known as reserved (for most of theme IANA ports reserved) using a csv input lookup.
See props.conf and transform.conf, Networking services are automatically defined for any event under the field called "Service", when the destination port is not known as reserved or standard port, the service name will defined under the value "Unknown".
- Top 10 pie chart and Top 100 destination port attempted with Network Service name identification
6. TOP Reporting Servers:
Data being represented by:
- Top 10 pie chart ad top 100 data Iptables Reporting Servers
Real-Time and Time-Range Google Maps view:
Real-Time and Time-Range Google Maps Dashboard, identify the source of connexion attempts


Event Search Interfaces:
Raw-Data and Charts Dedicated Event search interfaces:

And associated saved Searches...
System Dashboard, Iptables Index Activity:


Installation and utilization
Introduction
Installing and configuring Splunk is out of the scope of this post, installing Splunk is really easy and well done, in 10 minutes you'll be done ^^
As a brieve description, here is how Splunk for Iptables works:
- Configure Iptables to log dropped or rejected packets using Syslog
- Splunk collects our data and produces the IT intelligence
INFORMATION:
Please note that this application intends to analyse denied or dropped connections, any event containing following pattern will not be analysed by Splunk:
- "ACCEPT" OR "Accept" OR "ALLOW" OR "Allow"
Even if indexed by Splunk, if an event contains one of these patterns, it will be expected to be tagged as an accepted connection. If you need to adapt this general configuration to your own situation, please create a local Macro.conf containing the macro customized to your needs:
If you need custom settings, create your local Macro.conf:
$SPLUNK_HOME/etc/apps/iptables/local/Macro.conf:
### Iptables sourcetype
[iptables_src]
definition = sourcetype="iptables_source" NOT "ACCEPT" OR "Accept" OR "ALLOW" OR "Allow"
iseval = 0
Save your local/Macro.conf file and restart Splunk.
Installation and configuration will be done in a few steps:
SUMMARY OF STEPS:
Iptables / Syslog Configurations steps:
1. Set each Iptables reporting host to log events using SYSLOG
2. Configure SYSLOG to trap these events and put them in a dedicated log file of your choice
3. Test your Iptables / Syslog configuration to ensure events are being sucessfully trapped by your centralized Syslog
Splunk configuration steps:
4. Add Input source log file(s) in Splunk corresponding to the log file where your Syslog is trapping events
7. Open Splunk for Iptables and observe the magical power of Splunk ^^
Part 1 : Configuration of Iptables and Syslog
1. Set each Iptables reporting host to log dropped or rejected packets
Configuring Iptables is far away from the scope of this guide, the only thing required is to configure Iptables to log inbound dropped and rejected packets. (by default, Iptables logs its events to Syslog)
Iptables shall use a prefix pattern to log, this will be used first to manually recognize Iptables events in main syslog file, and then it shall be used to catched these events into a dedicated log file. (not obligatory but recommended)
Part 2 : Configuration of Syslog
In 2 steps:
- if you want to manage different Iptables reporting hosts servers from Splunk, then read the Multiple Iptables client configuration note
- If you just have one host to manage (Iptables and Splunk are installed in the same host), then just follow the common configuration section
MULTIPLE IPTABLES CLIENT CONFIGURATION NOTE: Remote and centralized Syslog configuration:
Configuring Syslog to send events from a Syslog host to a a remote Syslog server is out of the scope of this guide.
Therefore, if you want to send Iptables events of different hosts, you can choose between different solutions, as:
- Sending events using Syslog to a remote centralized Syslog
- Sending events from local log file using Splunk forwarder module
- Others (homemade scripts...)
I would recommend using "Rsyslog" (Enhanced Syslog version that comes with many modern Linux OS) to achieve this, which is indeed easy enough.
Here is in 2 steps a quick syslog centralized configuration: (remember to restart rsyslog after each modification)
1. In client rsyslog host, modify "/etc/rsyslog.conf" and add a section to send any events to your Syslog server: (adapt the example IP)
*.* @192.168.1.254:514
2. In syslog server configuration, create a configuration file that will catch any remote client Syslog events and put them into a dedicated per host log file:
Ensure your configuration name will be read after the iptables syslog config file. (see above, use numbered prefix)
Create "/etc/rsyslog.d/10-remotehosts.conf" with the following content: (Note: The iptables config we will create after will be called 08 to be read before this and intercept messages
$template PerHostLog,"/var/log/%HOSTNAME%.log"
$template RemoteHostFileFormat,"%TIMESTAMP% %HOSTNAME% %syslogfacility-text% %syslogtag%%msg:::sp-if-no-1st-sp%%msg:::space-cc,drop-last-lf%\n"
:inputname, isequal, "imudp" ?PerHostLog;RemoteHostFileFormat
& ~
Finally, achieve the rest to the configuration above to be able to intercept remote Syslog client events containing the iptables event tag and put them in a dedicated log file for all hosts.
COMMON CONFIGURATION for Single and Multiple Iptables installations:
1. Set Syslog to trap iptables events to a dedicated logfile
This configuration part will depend on your system and needs, i recommend the use of "rsyslog"
The goal is to configure syslog to trap any event containing a key word set as the iptables prefix into a dedicated log file
For example, with UFW you will have "[UFW BLOCK]" as a prefix.
If you set manually configure Iptables, just choose and report your log prefix. (eg. example "DROP(wan)"
In Debian/Ubuntu systems for example, create an rsyslog configuration file, example:
Create "/etc/rsyslog.d/08-iptables.conf" with the following content: (adapt with your log prefix)
:msg, contains, "DROP(wan)" /var/log/iptables.log
& ~
Restart rsyslog to take effect.
Part 3 : Configuration of Splunk (the easy part!)
Configure input file using Splunk Manager interface:
Go to "manager", "Data Input", and configure MANUALLY a new input file pointing to your iptables log file.
With settings by part configuration:
Host:
You can let the default settings, it does not mind as we don't use it to recognize the iptables reporting server.
Source type:
- Set the source Type: Manual
- Source type: iptables_source
Index:
- Set the destination Index: iptables_index
Configure input manually:
You can also add your input file manually, create a new file in "${APP_HOME}/local/inputs.conf" with the following content: (adapt to your case)
[monitor:///var/log/remote-hosts/iptables_myserver.log]
disabled = 0
followTail = 0
index = iptables_index
sourcetype = iptables_source

[monitor:///var/log/iptables_ufw.log]
disabled = 0
followTail = 0
index = iptables_index
sourcetype = iptables_source
And restart Splunk.
Good news, you're done!!!
Just wait a few minutes to let Splunk get the content of your iptables log file, then go to the splunk application